MXGP of Italy
Time to go:
Laps to go:
Status:
Elapsed:

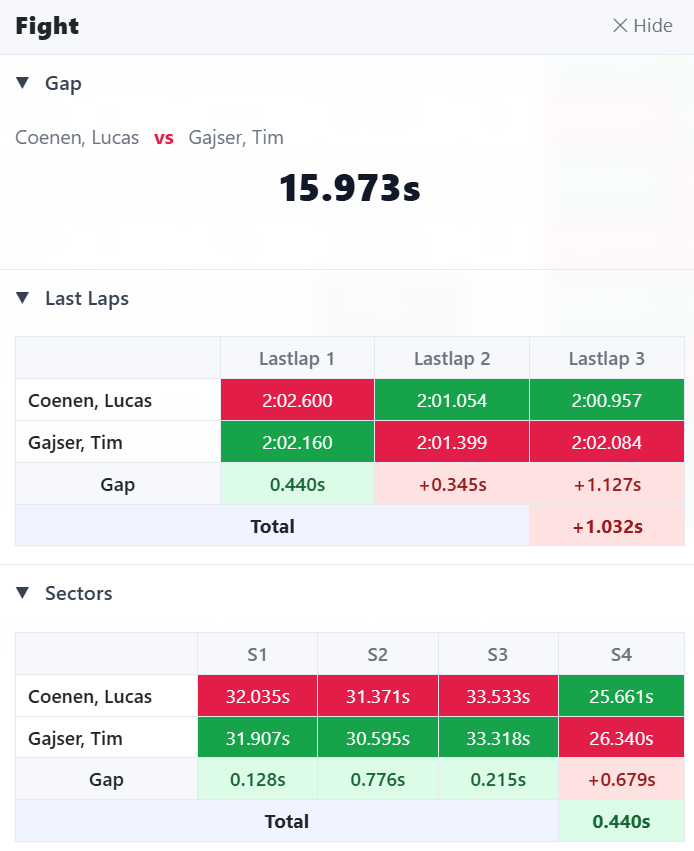
Fight Panel
When you select two riders, the "Fight Panel" appears on the bottom of your screen. The panel provides a side-by-side comparison of their lap times, sector times, and gaps. Note: The fight panel's data differs by session type, e.g. in practice/qualifying best sectors are shown, while in race sessions the current sectors are shown.

| - | Pos | Nr. | Name | Nat | Bike | TotalTime | Best Lap | in lap | Diff. First | Diff. Prev. | Laps | Lastlap | Lastlap-2 | Lastlap-3 | sector 1 | sector 2 | sector 3 | sector 4 |
|---|
You can only select 2 riders at a time!
Penalty
Fight
–
vs
–
–
| Lastlap 1 | Lastlap 2 | Lastlap 3 | |
|---|---|---|---|
| – | – | – | – |
| – | – | – | – |
| Gap | – | – | – |
| Total | – | ||
| S1 | S2 | S3 | S4 | |
|---|---|---|---|---|
| – | – | – | – | – |
| – | – | – | – | – |
| Gap | – | – | – | – |
| Total | – | |||
| Best Sectors | ||||
| S1 | S2 | S3 | S4 | |
| – | – | – | – | – |
| – | – | – | – | – |
| Gap | – | – | – | – |
| Total | – | |||